HORIZON TEMPERATURE PLOTS
For 23, 13, 9 and 3cm from the QTH of G4DDK
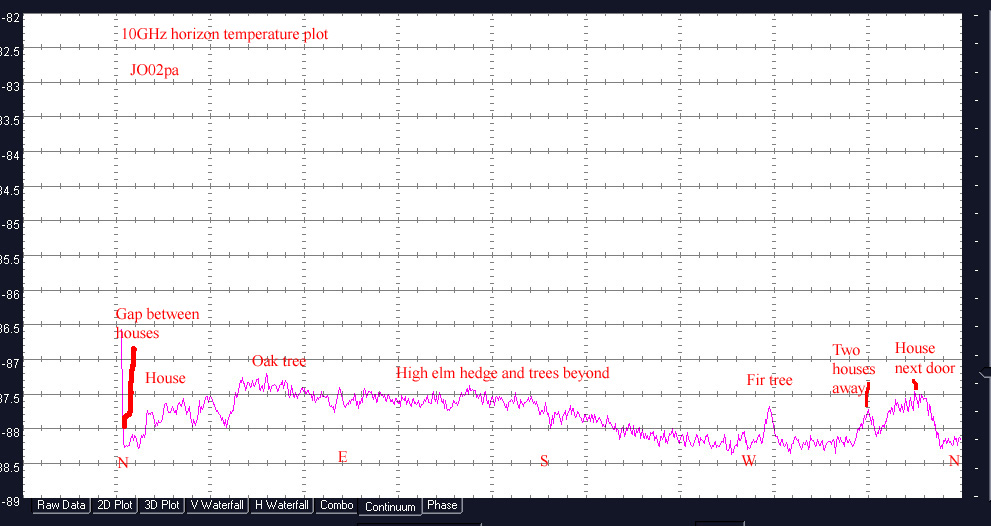
10GHz horizon temperature plot

This
plot
was obtained using Spectravue
on the SDR-IQ receiver, using the Continuum plot function.
My 10GHz system uses a 60cm Andrew Corp dish, DEMI 1dB preamp and DB6NT transverter (system nf about 2dB).
The mast is in the down position so that the dish is looking below the roof line.
Spectravue is set up with 0.5dB/Division and an FFT of 2
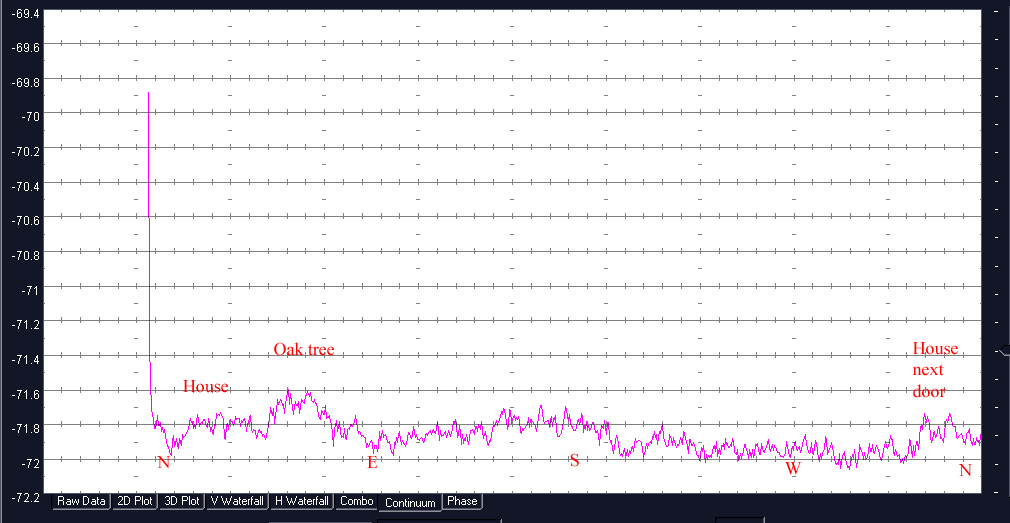
3.4GHz horizon temperature plot


1.3GHz horizon temperature plot

The vertical scale depends on receiver system gain and is slightly different on each band. 23cm has slightly higher gain than 13 and 3cm.
The 13cm system uses a 84 element G3JVL quad loop antenna, whilst the 23cm system uses 2 x 44 element yagis (Wimo).
The receiver system noise figure is about 2dB in each case.
Antenna gain on 23 and 13cm is roughly the same. The plots seem to indicate that the 13cm antenna is not working as well as the 23cm one as the variation in peak to trough is slightly less. However, performance is probably perfectly acceptable for 13cm terrestrial use.
Updated 17/11/10
Home
My 10GHz system uses a 60cm Andrew Corp dish, DEMI 1dB preamp and DB6NT transverter (system nf about 2dB).
The mast is in the down position so that the dish is looking below the roof line.
Spectravue is set up with 0.5dB/Division and an FFT of 2
3.4GHz horizon temperature plot

2.3GHz
horizon
temperature
plot

1.3GHz horizon temperature plot

The vertical scale depends on receiver system gain and is slightly different on each band. 23cm has slightly higher gain than 13 and 3cm.
The 13cm system uses a 84 element G3JVL quad loop antenna, whilst the 23cm system uses 2 x 44 element yagis (Wimo).
The receiver system noise figure is about 2dB in each case.
Antenna gain on 23 and 13cm is roughly the same. The plots seem to indicate that the 13cm antenna is not working as well as the 23cm one as the variation in peak to trough is slightly less. However, performance is probably perfectly acceptable for 13cm terrestrial use.
Updated 17/11/10
Home